Graph Analytics
The quickest path to new avenues of insights and value creation available with the least amount of added effort for your business!
But what is a graph?
A graph is a way to represent relationships between things. Unlike the XY plots you may be familiar with, a graph in this context consists of nodes and relationships.
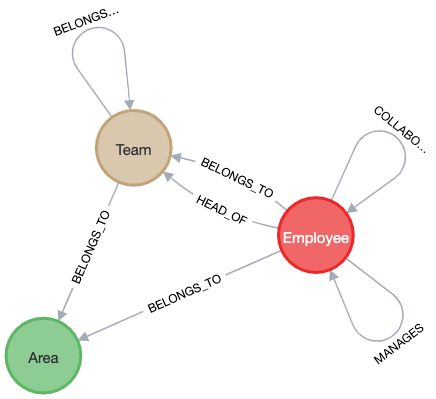
For example, in a company, each employee can be a node, and the relationships can represent who manages whom, or which teams they work in. Each node and relation can also have properties, such as job title, department, or start date. An example of a graph schema for this can be seen to the right.
We have a lot of data warehouses and are really good at SQL, so why use a graph?
First of all, data is created in relation to other types of data. Think about it! Only the name of a customer, doesn't tell us much. It is when adding what products they hold, income bracket, education, age, who they live with, that we get a sense of the customer. In a graph all those relations are stored just the same as the nodes themselves. In SQL, you first have to spend a lot of time creating and validating those relations
Secondly, a graph structure helps us visualize and analyze complex connections and dependencies in an intuitive way - this is one of the reasons why it is such a popular tool in anti-money laundering analysis.
Thirdly, writing graph-code is up to 100x more efficient in terms of lines of code (compared to doing the same query in SQL), it will execute up to 1000x faster than in a relational DB, and - most importantly - with it comes a whole new set of algorithms that open up completely new avenues of insights and thereby value creation.
What are some typical graph use-cases?
1. Financial Crime Analysis
Use Case: Identify fraudulent transactions and suspicious patterns in financial networks.
Algorithms: Louvain (Community Detection) and Dijkstra's (Shortest Path).
2. Supply Chain Robustness
Use Case: Model supply chains to analyze dependencies and optimize logistics.
Algorithms: Betweenness Centrality and PageRank.
3. Customer Journey Analysis
Use Case: Analyze user navigation and purchasing behavior for personalized recommendations.
Algorithms: Personalized PageRank and Cosine Similarity.
4. Cybersecurity Vulnerability Analysis
Use Case: Map IT systems to detect vulnerabilities and model attack paths.
Algorithms: Shortest Path and Strongly Connected Components.
A few non-obvious use cases with massive potential are:
AI Compliance: Audit Trail for LLM-User Interactions and LLM-Based Decisions
Problem Statement:
Traditional systems lack transparent audit trails for LLM-user interactions, making it difficult to:
- Trace data provenance — Identify which data sources contributed to a specific response.
- Reconstruct query paths — Understand how the LLM reasoned through the data.
- Verify compliance — Demonstrate alignment with policies and regulations during audits.
Solution:
A graph database can create a traceable audit trail by:
- Modeling data sources and user interactions as nodes and edges.
- Logging interactions, linking queries to retrieved data and outputs.
- Tracking query paths and dependencies, preserving reasoning chains.
- Maintaining data versions and snapshots for immutable records.
Value Add:
- Full Traceability: Retrace steps to show exact sources and reasoning paths.
- Provenance Assurance: Guarantees data lineage and accountability.
- Error Investigation: Identifies issues by linking outputs to specific data.
- Compliance Readiness: Provides queryable audit logs to meet regulations.
- Transparency: Demonstrates input-output influence to reduce bias and errors.
Take your Virtual Assistants to the Next Level with Graph-augmented RAG
Problem Statement:
Pure vector-based Retrieval-Augmented Generation (RAG) systems rely solely on semantic similarity to retrieve relevant documents based on embeddings. While effective for keyword and contextual matching, they often struggle with:
- Complex relationships between entities (e.g., hierarchies, dependencies).
- Multi-hop reasoning (linking data points across disconnected documents).
- Contextual gaps caused by unstructured or loosely connected data.
Solution:
Graph-Augmented RAG integrates a knowledge graph into the retrieval pipeline, enriching the semantic search with explicit relationships and structured metadata extracted from documents. The process includes:
- Graph Construction: Entities and relationships are mapped into a Neo4j graph database or similar graph structure.
- Hybrid Querying: Combines vector similarity with graph traversal queries to leverage both contextual embeddings and logical relationships.
- Enhanced Reasoning: Enables multi-hop traversal to connect distant but related information (e.g., finding dependencies between contracts or policies).
Value Add:
- Contextual Accuracy: Enhances retrieval by combining semantic relevance (vectors) with logical connections (graphs).
- Multi-Hop Reasoning: Supports complex queries requiring traversal through relationships —e.g., linking a vendor, its contracts, and associated obligations.
- Reduced Ambiguity: Resolves context gaps and overlaps by integrating explicit relationships between data points.
- Improved Scalability: Efficiently scales as new nodes and relationships are added, maintaining data integrity and search performance.
- Insight Generation: Uncovers hidden patterns and dependencies critical for compliance, governance, and risk analysis.
Optimize your Business by Understanding Cross-Organizational Collaboration
Problem Statement:
The connections that define the day-to-day work of modern organizations are complex and dynamic. However, understanding them is key to be able to answer questions like:
- Who are the people/teams holding it all together?
- Who can we not afford to lose?
- Who seems to be overburdened?
- Who is becoming detached from their colleagues?
- Who is communicating across Chinese walls?
Solution:
Developing a graph-based approach to map who is e-mailing, chatting, writing or co-signing documentation, and is in meetings with whom provides a network where graph analysis can be applied. Steps to be taken involve:
- Modeling employees and interactions as nodes and edges; storing details as node and edge properties.
- Ingesting company-hierarchy data
- Running graph algorithms such a different centrality metrics to identify key/lynchpin resources
- Running clustering algorithms to identify groupings of closely-connected employees
Value Add:
Being able to quickly identify the people who are engaged in most things at once, the people that span the broadest across the organization in their daily work, the ones who act as brigdes between network-identified groups (e.g. project teams). Each of these insights can be used proactively to
- find people who at risk of burning out/coming down with stress
- avoid creating organizational gaps when reorganizing - (re)moving that key connection point may slow things down significantly for those relying on information being passed through or generated by that person
- optimize seating planning to put highly integrated teams physically close to each other
- identify suspicious communication patterns
Unlock the Power of Graphs
Graph databases are transforming the way businesses uncover insights, visualize connections, and make data-driven decisions. Whether it's detecting fraud, optimizing supply chains, or ensuring compliance, graphs are at the core of modern analytics.
At AI & Web3 Consulting ApS, we specialize in leveraging graphs and AI to help you unlock hidden patterns, improve operational efficiency, and gain a competitive edge. Let’s build smarter solutions—together!
Get in Touch